Easy Charts
The “Easy Charts” module allows you to create animated charts to present your data in a more engaging and professional way. Enhance your information display with dynamic and customizable graphs.
Cool examples
Dark mode
Module settings
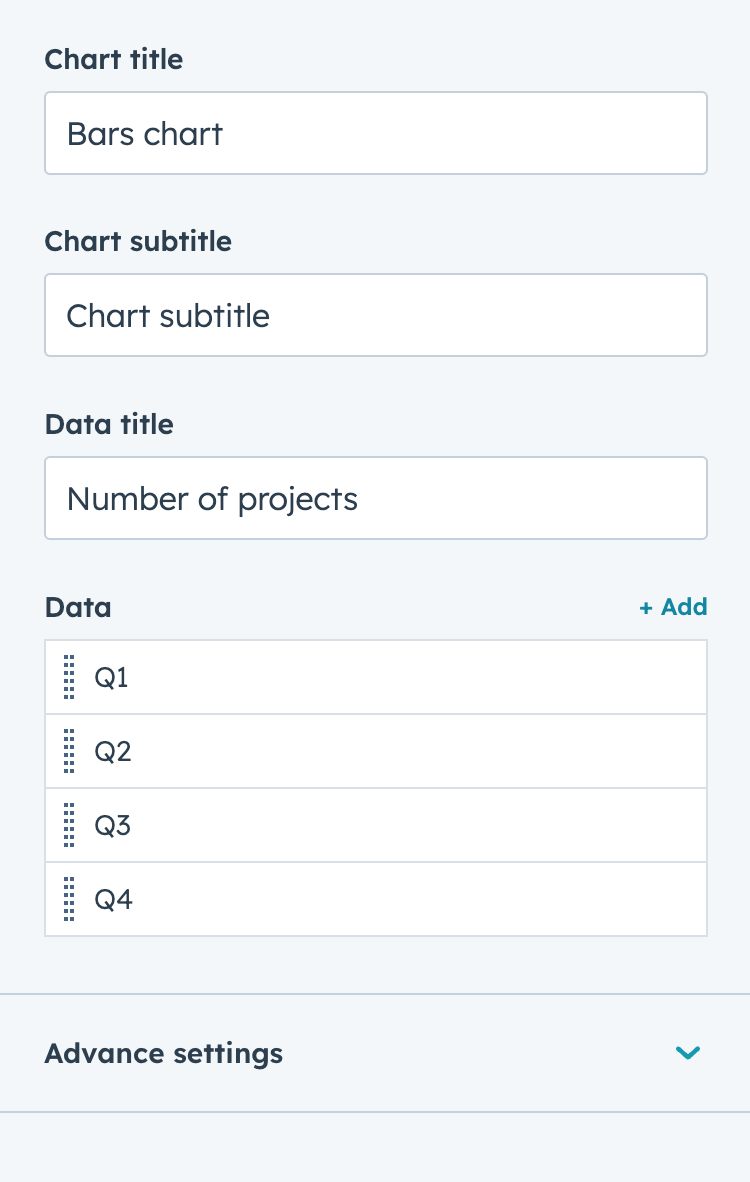
Content
Content
- Title
- Subtitle
- Data title
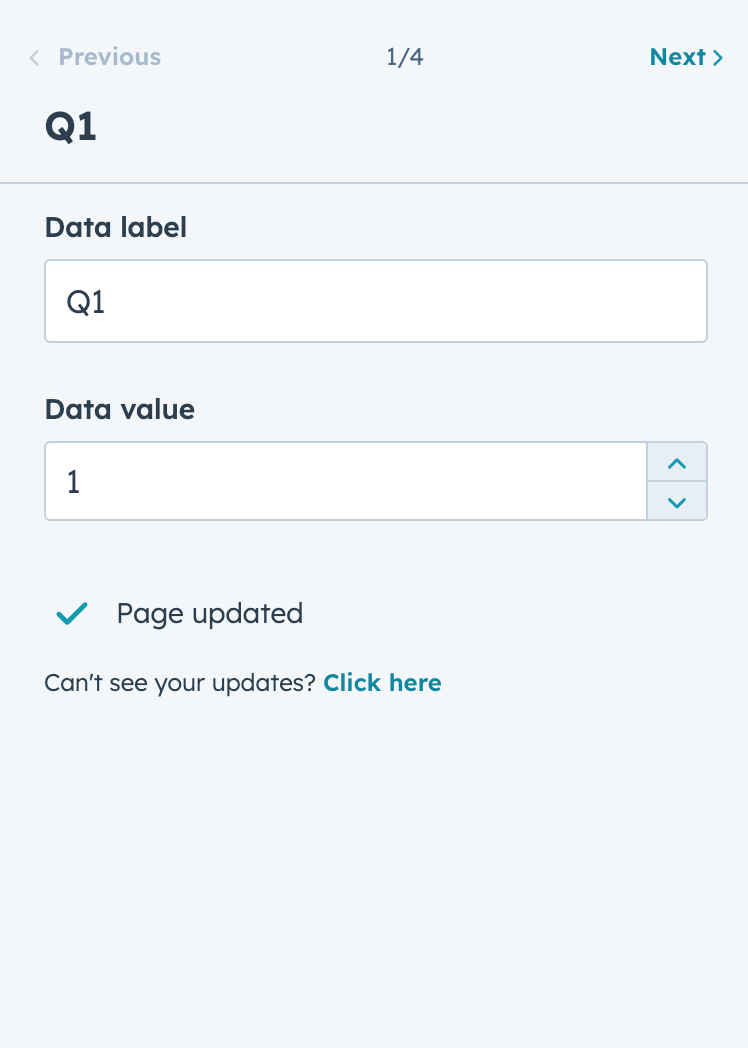
- Chart data
- Label
- Value
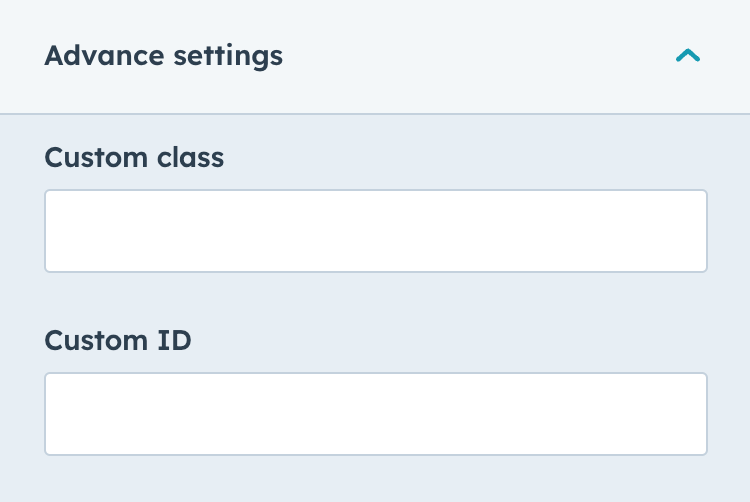
Advanced settings
- Custom Class
- Custom ID
Styles
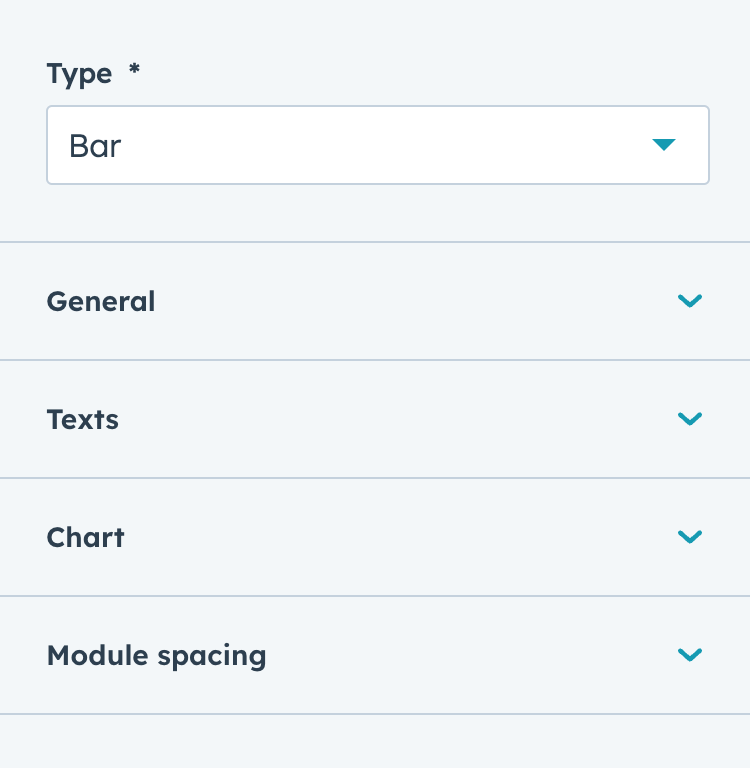
Type
- Bar
- Pie
- Doughnut
- Line
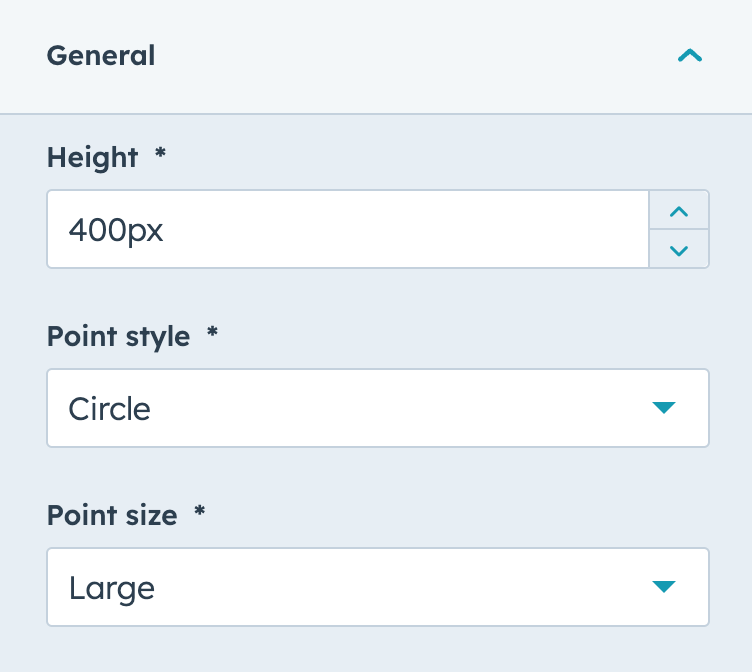
General
- Height
- Point style
- Point size
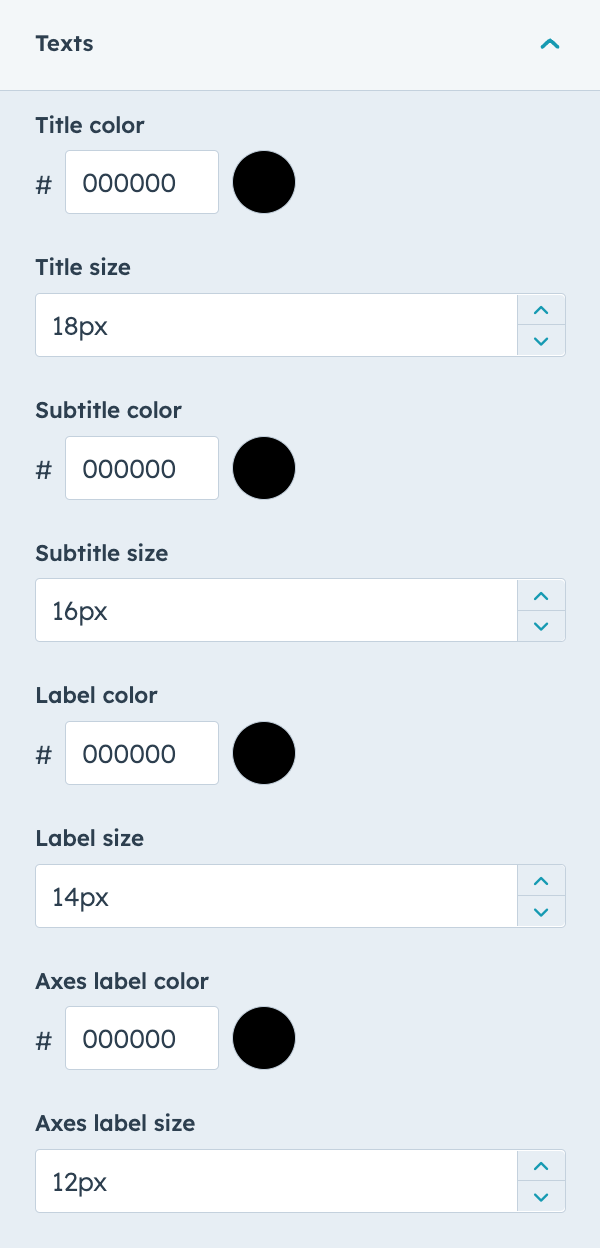
Texts
- Title color & size
- Subtitle color & size
- Label color & size
- Axes label color & size
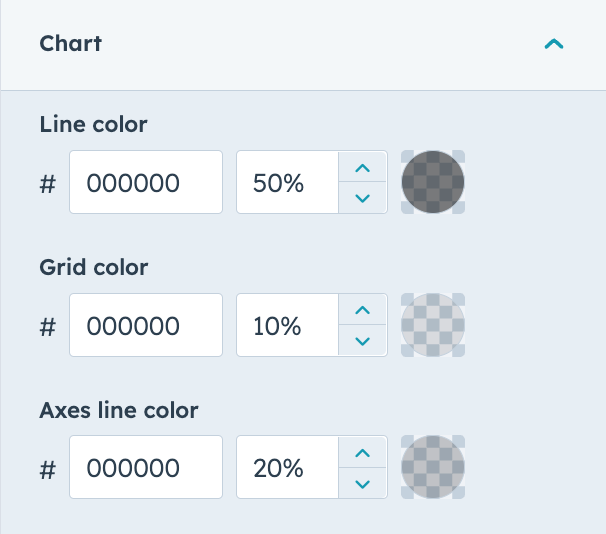
Chart
- Line color (line chart type)
- Grid color
- Axes line color
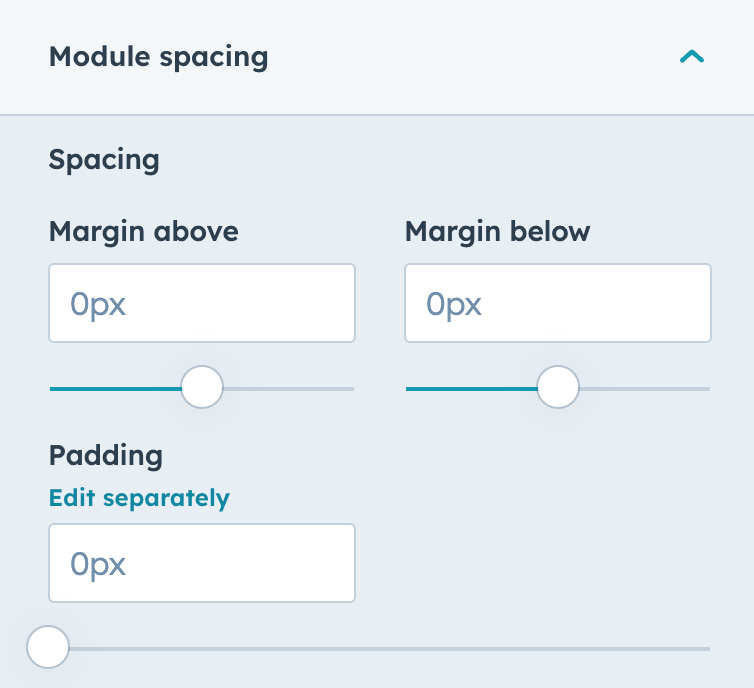
Module spacing
- Margin
- Padding
